

1900
Chart 580: The Lake That Wasn't There1900 Chart 580: The Lake that Wasn’t There
Powell Lake’s Journey from Pencil to Print
The nineteenth-century British Admiralty charts of the British Columbia coast constitute a layered historical archive that reveals not only the evolution of hydrographic surveying but also the lived practices of mariners who relied on these documents in dynamic, often hazardous waters. The charts depicting Vancouver Island, Texada Island, Johnstone Strait, Fitz Hugh Sound, and the Powell River region were produced across several decades by surveyors such as Captain George Henry Richards, Staff Commander Daniel Pender, and Staff Commander J.T. Gowland.
Although they share a common institutional origin, these charts differ significantly in scale, geographic scope, cartographic conventions, and material condition. Some survive as pristine printed sheets, while others bear pencil annotations that testify to their use as working navigational tools. Examining these differences illuminates the interplay between official hydrographic knowledge and the informal, experiential knowledge of mariners who navigated the coast.
The earliest charts in the group derive from Captain Richards’s surveys in the late 1850s and early 1860s, which laid the foundation for Admiralty mapping of the Strait of Georgia and the northern Gulf Islands. These charts, including the cataloged “Strait of Georgia, sheet 2,” represent the initial systematic efforts to measure depths, identify hazards, and outline shorelines in a region that may have been only partially charted by Survey Vessels.
Later charts, particularly those produced by Daniel Pender between the 1860s and 1880s, exhibit a marked increase in precision and coverage. Pender’s surveys of Johnstone Strait and the northeastern coast of Vancouver Island, published in the 1880s, include dense soundings, refined shoreline shading, and numerous inset plans of harbours and anchorages.
Gowland’s 1863 survey of the Texada–Johnstone Strait corridor, published in 1865, represents another strand of Admiralty work, one that focused on a particularly complex and strategically important passage. By the late nineteenth century, composite regional maps such as “Vancouver Island and Adjacent Coasts of British Columbia” synthesized decades of survey data into large sheets intended for long-distance navigation rather than close-quarters piloting.
These charts differ not only in their survey origins but also in their intended navigational functions. Large-scale nautical charts are at approximately 1:146,000, created by cartographers for precise navigation through narrow channels, tidal rapids, and reef-strewn passages. They include extensive soundings, tidal notes, and hazard markings. Medium-scale regional maps, by contrast, emphasize coastline shape, mountain ranges, and major inlets, providing mariners with a broad geographic framework. The inset plans, such as those of Waddington Harbour, Frederick Arm, Weymouth Bay, and Tribune Bay, are extremely large-scale and were intended for anchoring, logging operations, or approaches to river mouths.
These differences in scale reflect the Admiralty’s recognition that the British Columbia coast demanded multiple cartographic perspectives: one for understanding the region’s overall geography, another for navigating its treacherous channels, and yet another for entering its small harbours and coves.
The charts also differ in their cartographic conventions, which evolved at times over the course of a year, as shown in the example of Chart 580 for 1900. Earlier sheets employ serifed typography, hachured shoreline shading, and relatively sparse soundings. Later charts adopt standardized Admiralty fonts, more sophisticated stippling and contour shading, and a denser, more systematic distribution of depth measurements. These changes reflect broader nineteenth-century developments in hydrographic science, printing technology, and Admiralty standardization.

1900 JD Nare’s Chart (click on image to enlarge)
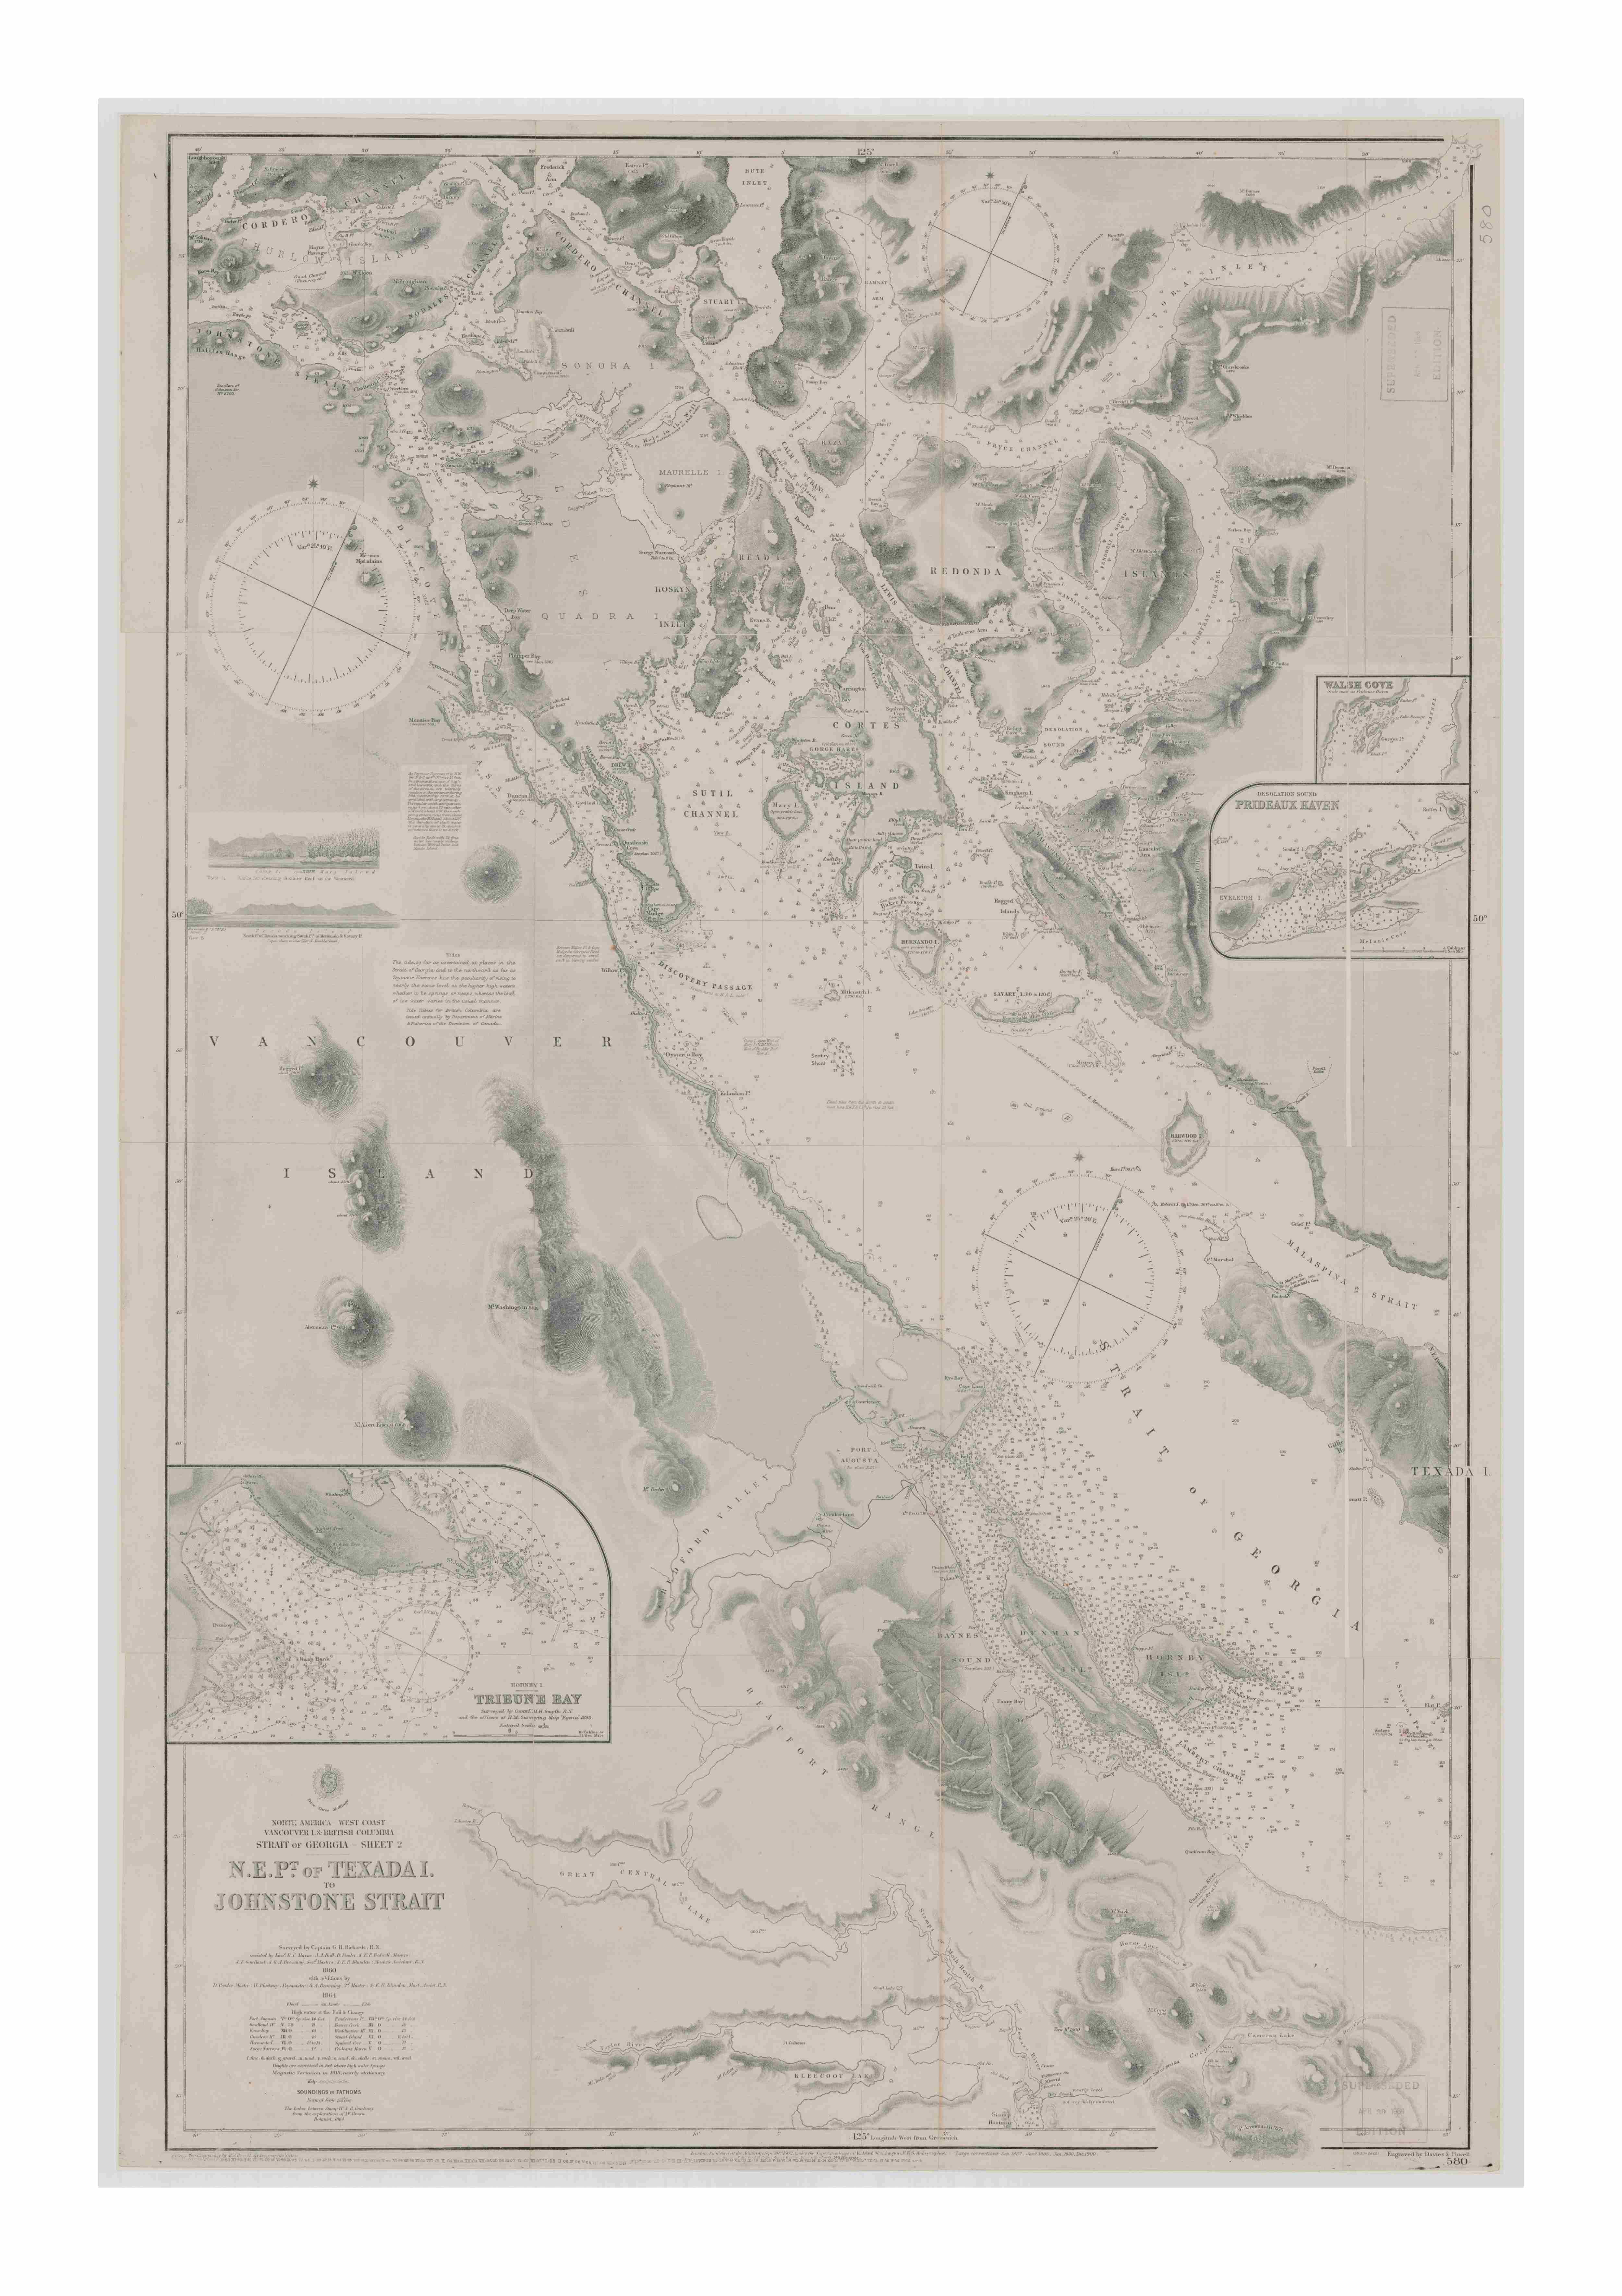
Chart 580 Full (click on image to expand)

Chart 580 – Lake Drawn in (click on image to expand)

Chart 580 – Hand drawn (click on image to expand)
They also reveal the Admiralty’s growing confidence in its ability to accurately represent the coast, even as the environment remained dynamic. One of the most striking differences among the charts is the presence or absence of pencil markings. Charts with pencil annotations were almost certainly working charts used aboard vessels. Mariners routinely added their own observations: updated soundings, newly discovered reefs, changes in logging camps or mission sites, bearings, courses, anchorage notes, and tidal information.
These annotations were essential because Admiralty charts, though authoritative, could not be updated in real time. Pencil markings often reflect local knowledge, including Indigenous knowledge and insights from loggers or fishermen that official surveys may not capture. In regions such as Powell Lake and Harwood Island, where settlements, logging roads, and camps changed rapidly, mariners added features that would not appear on printed charts for years, if ever. The presence of notes such as “Reef reported” demonstrates how mariners integrated uncertain or provisional information into their navigational practice.
The absence of pencil markings on other charts suggests that they served different purposes. Unmarked charts were likely library copies, archival reference sheets, or duplicates kept for collection rather than navigation. The pencil markings may also represent charts created after extensive use or chart information from aboard vessels. Their pristine condition highlights the difference between charts that serve as official products of the Admiralty and those that are tools shaped by mariners’ hands.
The coexistence of printed detail and pencil annotation reveals a hybrid knowledge system in which official hydrographic surveys provided a baseline, while mariners supplied continuous updates based on experience. Printed charts represent the Admiralty’s attempt to impose order on a coastline that was, in practice, constantly changing. Pencil-marked charts represent the mariner’s world, shaped by shifting sandbars, seasonal log booms, tidal rips, and the unpredictable behaviour of coastal waters. Together, they form a composite historical record richer than either could provide alone.

Extract 1 (click on image to enlarge)

OCB 580-511A (click on image to expand)
In sum, the differences among these charts differences-in-scale, survey origin, publication date, cartographic conventions, and physical markings reflect the evolving relationship between hydrographic science and maritime practice on the British Columbia coast. The printed charts embody the Admiralty’s authoritative vision, while the annotated charts embody the lived realities of navigation. Their side-by-side presence reveals the dynamic interplay between official knowledge and local experience, between the stability of print and the adaptability of pencil, and between the surveyed coast and the coast as encountered. These charts, taken together, offer a rare and invaluable window into the material culture of nineteenth-century navigation and the complex maritime environment of the Pacific Northwest.
For much of the nineteenth century, Powell Lake existed only as a faint interruption in the coastline on British Admiralty charts, an unnamed river mouth, a vague indentation, a place noted more for what surveyors could not see than for what they could. The great inland lake that would later define the region’s geography, economy, and identity, Powell Lake, was absent from the printed record.


SERIES – Charts File 1 Chart 580 Etched by Edward Powell – Captain Richards 1862 – 1900 adds Powell Lake-page2 26 (8) (click on image to enlarge)

SERIES – Charts File 1 Chart 580 Etched by Edward Powell – Captain Richards 1862 – 1900 adds Powell Lake-page2 26 (10) (click on image to expand)
It was not that the lake was unknown to the Sliammon (Tla’amin) people, who had lived along its shores for countless generations, nor to the early loggers and prospectors who ventured inland. Rather, it was absent because the Admiralty surveyors, working from the sea outward, had no mandate to map the interior unless it directly affected navigation. For decades, the lake remained invisible to the official cartographic world, even as it shaped the lived landscape of the coast.
Although surveyors included the lake in Atlases printed in other countries, those printed in the Canadian Commonwealth omitted its name but sometimes included its outline.
The earliest charts of the area, produced by Captain George Henry Richards in the early 1860s and later corrected by Daniel Pender, show Harwood Island, Atrevida Reef, and the shoreline north toward Sliammon Village Tla’amin) with admirable precision. Yet inland, where Powell Lake should have appeared, the paper is blank. The coastline is depicted with clear precision, while the interior remains open to interpretation.
It is only in later working copies of charts carried aboard vessels, handled by mariners, loggers, and local pilots, that Powell Lake begins to appear, not as an engraved feature but as a pencilled addition. These pencil markings, tentative and provisional, represent the earliest cartographic acknowledgment of the lake’s existence in the Admiralty tradition.
The handwritten addition of “Powell Lake” to these charts signifies a pivotal moment in the region’s history. Among the charts available, there was a series from January 1, 1900, to December 31, 1900, that included only Powell Lake as a correction. Notably, it was the only significant change along the entire coast of British Columbia, involving the addition of a lake named Powell Lake and the reprinting of the map eight times.
Logging crews pushed inland through the 1880s and 1890s, established camps along the lower river, and turned the lake into a working corridor for moving timber. Local knowledge of Indigenous nations, settlers, and industrial companies flowed back to the coast, where mariners updated their charts to reflect the realities they encountered. The pencilled lake thus serves as a record of knowledge moving from land to sea, from oral tradition and practical experience into the formalized world of hydrographic documentation.
The Admiralty’s printed charts, however, lagged. Hydrographic surveying was an expensive, labour-intensive process, and the Admiralty prioritized areas of direct navigational concern. Powell Lake, being an inland, nontidal lake, did not meet the threshold for immediate inclusion. Only when the region’s economic significance grew—particularly with the approach of the twentieth century and the early stirrings of industrial development—did the Admiralty begin to incorporate inland features into its printed sheets.

SERIES – Charts File 1 Chart 580 Etched by Edward Powell – Captain Richards 1862 – 1900 adds Powell Lake-page2 (click on image to expand)

SERIES – Charts File 2 Chart 580 Etched by Edward Powell – Captain Richards 1862 – 1900 corrections with Powell Lake – page2 (click on image to expand)

SERIES – Charts File 3 Chart 580 Etched by Edward Powell – Captain Richards 1862 – 1900 corrections with ORIGINAL Powell Lake – page2 (click on image to expand)

SERIES – Charts File 4 Chart 580 Etched by Edward Powell – Captain Richards 1862 – 1900 cor (click on image to expand)

SERIES – Charts File 5 Chart 580 Etched by Edward Powell – Captain Richards 1862 – 1900 NO POWELL Corrections Jan 1900 – page 2 (click on image to expand)

SERIES – Charts File 6 Chart 580 Etched by Edward Powell – Captain Richards 1862 – 1900 NO (click on image to expand)
By 1900, Powell Lake finally appeared in print, no longer a pencilled afterthought but an engraved feature, fixed in copperplate and disseminated across the maritime world.
The transition from pencil to print marks a profound shift in how Powell Lake was recognized, and the printed lake signalled that the region had entered the Admiralty’s sphere of recognized geography. It meant that surveyors had either received reliable inland information or had undertaken enough reconnaissance to justify engraving the lake’s outline.
It also reflected the growing importance of the area as a site of resource extraction. The lake’s appearance in print coincided with the early stirrings of industry that would culminate in the founding of the Powell River Company in 1909. In this sense, the printed lake is a cartographic precursor to the industrial town that would soon rise at its outlet.
The pencil markings on earlier charts, by contrast, preserve a more intimate layer of history. Local guides, loggers, and Indigenous knowledge keepers first showed mariners the lake, and the charts depict it as they revealed it.
They reveal the informal networks of information that shaped navigation long before the Admiralty engraved its authoritative version. These markings also remind us that charts were living documents, handled, corrected, and adapted by those who used them. A pencilled lake is a sign of a chart in active service, a tool shaped by people who needed it to reflect the world as they experienced it.
When Powell Lake finally appeared in print around 1900, it entered a new phase of its cartographic life. The engraved lake carried with it the authority of the Admiralty, fixing its shape and position for mariners who might never see it firsthand. Yet the printed version also obscured the layered history of how the lake came to be known. The pencil markings, ephemeral and easily erased, captured the moment when Powell Lake was still a local feature, known intimately but not yet officially recognized. The printed lake, by contrast, represents the moment when Powell River stepped onto the stage of global maritime geography.

SERIES – Charts File 7 Chart 580 Etched by Edward Powell – Captain Richards 1862 – 1911 Corrections final 1911 Powell-page2 (click on image to expand)

SERIES – Charts File 8 Chart 580 Etched by Edward Powell – Captain Richards 1862 – 1905 Corr (click on image to expand)

SERIES – Charts File 9 Chart 580 Etched by Edward Powell – Captain Richards 1862 – 1893 No Powell-page2 (click on image to expand)
In this way, the story of Powell Lake’s cartographic emergence mirrors the broader history of the region. What began as a place known through lived experiences of fishing, hunting, logging, and travel gradually became a place defined by industry, settlement, and official recognition. The lake’s journey from pencil to print encapsulates the transformation of Powell River from a landscape of Indigenous stewardship and early resource use into a site of industrial modernity.
It also reminds us that maps are not merely representations of geography; they are records of changing relationships between people and place.
Today, when we look at the printed charts of the early twentieth century, it is easy to forget that Powell Lake was once absent from the official record. Yet the pencilled versions, with their tentative lines and handwritten labels, preserve the moment when the lake first entered maritime cartography. The lake’s markings were a quiet reminder of those who knew it long before the UK Hydrographic Office pencilled it onto the chart, and of the shifting ways Powell Lake was entered on the map.
The lake’s appearance in print around 1900 is thus not merely a cartographic milestone but a historical turning point, one that marks Powell River’s emergence into the documented world and foreshadows the industrial transformation that would soon reshape the region.
References:
2. Land Title and Survey Authority of British Columbia, Hand-Coloured British Hydrographic Maps Showing Indian Reserves: Strait of Georgia, Sheet 2 (North East Point of Texada Island to Johnstone Strait), surveyed by G. H. Richards et al., 1860 & 1864, LTSA Indian Reserve Maps Collection, digital edition hosted by University of Victoria Libraries.
3. Admiralty Hydrographic Department, Catalogue of Admiralty Charts, Plans, Views, and Sailing Directions (London: Hydrographic Office, various editions).
4. Canadian Hydrographic Service, Electronic Navigational Charts (ENC) Maritime Chart Service, Fisheries and Oceans Canada.
5. Government of Canada Collection Search ( Chart 580 Series)